On a personal note, I think one of the biggest drawbacks in loving AFL and wanting to do analysis in AFL is that good data just isn’t readily available for analysis. There are a few main things preventing analysis of AFL from growing within Australia. If we take out the obvious data access issues https://thearcfooty.com/2016/09/05/the-afl-needs-to-go-beyond-the-box-score/ another drawback is that even the basic data access is limiting.
For one to get access to “boxscores” short of emailing the great folks at http://afltables.com/afl/afl_index.html or http://www.footywire.com/ you just can’t get access that is readily available. The only people who are able to get access are those that learn or get someone else to web-scrape for them.
This has many drawbacks for the AFL community at large. Which I won’t go into here.
So what I propose here to do, is go through a short example just getting one round of data from Wikipedia, and one games worth of data from footywire it won’t be the most efficient way of getting the data that is not the aim of this exercise of mine. The aim of this is to show a few different ways you can get the data and clean it up so that you at home can answer questions you have about footy.
The Set up:
First you need to set up R and R studio.
You can download them using the links below
https://www.rstudio.com/ once you have installed them both
Step 1: Start a new script


From there we need to install the packages to scrape the data we want!
Step 2 Installing the relevant packages
In the bottom left hand corner you should be able to see the install button, this helps you install all the packages you will need below.

Enter in the packages you need one by one and click install!
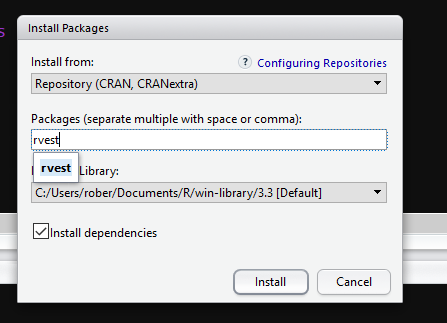
Once you have done it for the following packages, stringr, XML, rvest, tidyr and dplyr you can just use library (see below) or just tick the check box in the bottom right
library(stringr)
library(XML)
library(rvest)
library(tidyr)
library(dplyr)

Step 3 Go to website get some data
Lets say you want to be able to scrape Wikipedia for AFL data. This example will use 2016

For the first part of the example I will use Wikipedia to get a round of AFL data.

#the first step is getting the html (data) in from the page ("https://en.wikipedia.org/wiki/2016_AFL_season")
afl_season<-read_html("https://en.wikipedia.org/wiki/2016_AFL_season", encoding = "UTF-8")
#once you have all the html, you want to find the tables
tables<-html_table(afl_season, fill = TRUE)
tables #this will print all the tables in your console window
When you do that you will end up with something like below. What you want to focus on here is the [[19]] this means that the Round 18 data you see is the table 19!

As an example lets start from the beginning and get round 1 of AFL data, this would be table 2
table.example<-tables[[2]] ##just looking at round 1
names(table.example) #see the variable names
str(table.example) #see the data structure
View(table.example) #view the data!!!

Thats great, what we can see is that X1 seems to contain the dates, X2 contains the winning team name and score etc.
The number to the left correspond to the rows, think about it as rows in an excel sheet. So really our data starts in row 3

So now we have the data, all we have to do is get it into a format that we want and then we can do all the fun analysis type things like maybe I don’t know building your own ELO.
Step 4 Cleaning the data (the really fun stuff)
Our table here is table.example but it contains rows we do not want (rows 1,2,12) so we delete them.
df1<-table.example[-c(1,2,12),] View(df1) #we also want some sort of label on our data for round 1<br data-mce-bogus="1"> df1$round<-"Round 1" ##add a label so I know what round it is
From here we can see we don’t really want the columns X3 or X5 or in other words we want to select columns X1 ,X2, X4, X5 and our newly created round.
df2<-select(df1, X1, X2, X4,X5,round) #just getting the columns that I want
For the cleaning of the data we use what is called “regular expressions” I am following the tutorial here https://rstudio-pubs-static.s3.amazonaws.com/74603_76cd14d5983f47408fdf0b323550b846.html
I want to separate out time from the day of the game I can do so like below
df3<-extract(df2, X1, into = c("Date", "Time"), "([^(]+)\\s+\\(([:graph:]+).") ### seperates the date and the time
 View(df3)

So now if we view df3 the table isn’t looking too bad, I would probably want to create a new column for winning/losing team goals, behind and total. Separate out the ground from the crowd size and then we have one rounds of scores.
#getting the winning score

df4<-extract(df3, X2, into = c("winning team", "winning Score"), "([^(]+)\\s+\\(([0-9]+).")
#what this does is take the numbers but only the numbers in the () #prettycoolay

Next we would want to get the losing teams score
df5<-extract(df4, X4, into = c("losing team", "Score"), "([^(]+)\\s+\\(([0-9]+).") ##getting the losing score

View(df5)
Now lets separate the Venue from the crowd
df6<-separate(df5,X5,into=c("Venue","Crowd"),sep='[(]crowd:',remove=TRUE,convert=FALSE)
df6$Crowd<-gsub("\\)","",df6$Crowd)
View(df6)
Now lets separate out the behinds.
df7<-separate(df6, 'winning team',into=c("winning.team","winning.behinds"),sep="\\.")
df8<-separate(df7,'losing team', into = c("losing.team","losing.behinds"),sep="\\.")
View(df8)
Now for the finale the GOALS!
df9<-separate(df8, winning.team, c("winning.team", "winning.goals"), "(?<=[a-z]) ?(?=[0-9])")
df10<-separate(df9, losing.team, c("losing.team", "losing.goals"), "(?<=[a-z]) ?(?=[0-9])")
View(df10)

Now I understand that it might seem a bit overwhelming especially if you are new to R. My next blog post I will try and go through the lines and break them down a bit more into smaller chunks
But hopefully this is enough to get the juices flowing.
